Ambition set the direction. Now comes the transition.
A decade of target-setting has built a critical mass of ambition - tipping points reached across sectors, leading companies showing what’s possible. It has also surfaced the harder work: the challenges that need longer-term transition - capital investment, routes to market, supply structures that don’t yet exist.
That groundwork is what makes sector-level transition thinkable at all. But boards, investors and standard-setters now expect evidence of a transition actually underway.
And a transition is made of decisions: which sites to invest in, which suppliers to develop, where capital and effort move first. Reporting can’t drive those decisions - it faces backwards, built to assess last year. Decisions need a forward story: where a sector is heading, where a company sits within it, what each site can actually change - and what that delivers, by when.
Reverberate goes further than telling that story. We model the future it points to - so you can see the transition before you commit to it.
From 50,000 feet to 30 centimetres.
We model the transition at three levels, and connect them - because a sector pathway means nothing until it reaches a site, and a site tells you nothing until you know its sector.

Sector
50,000 ftWhere each sector's transition is heading: decarbonisation pathways, the emerging performance envelope, and the nature pressures - water, land, ecosystems - that will shape it as surely as carbon does.
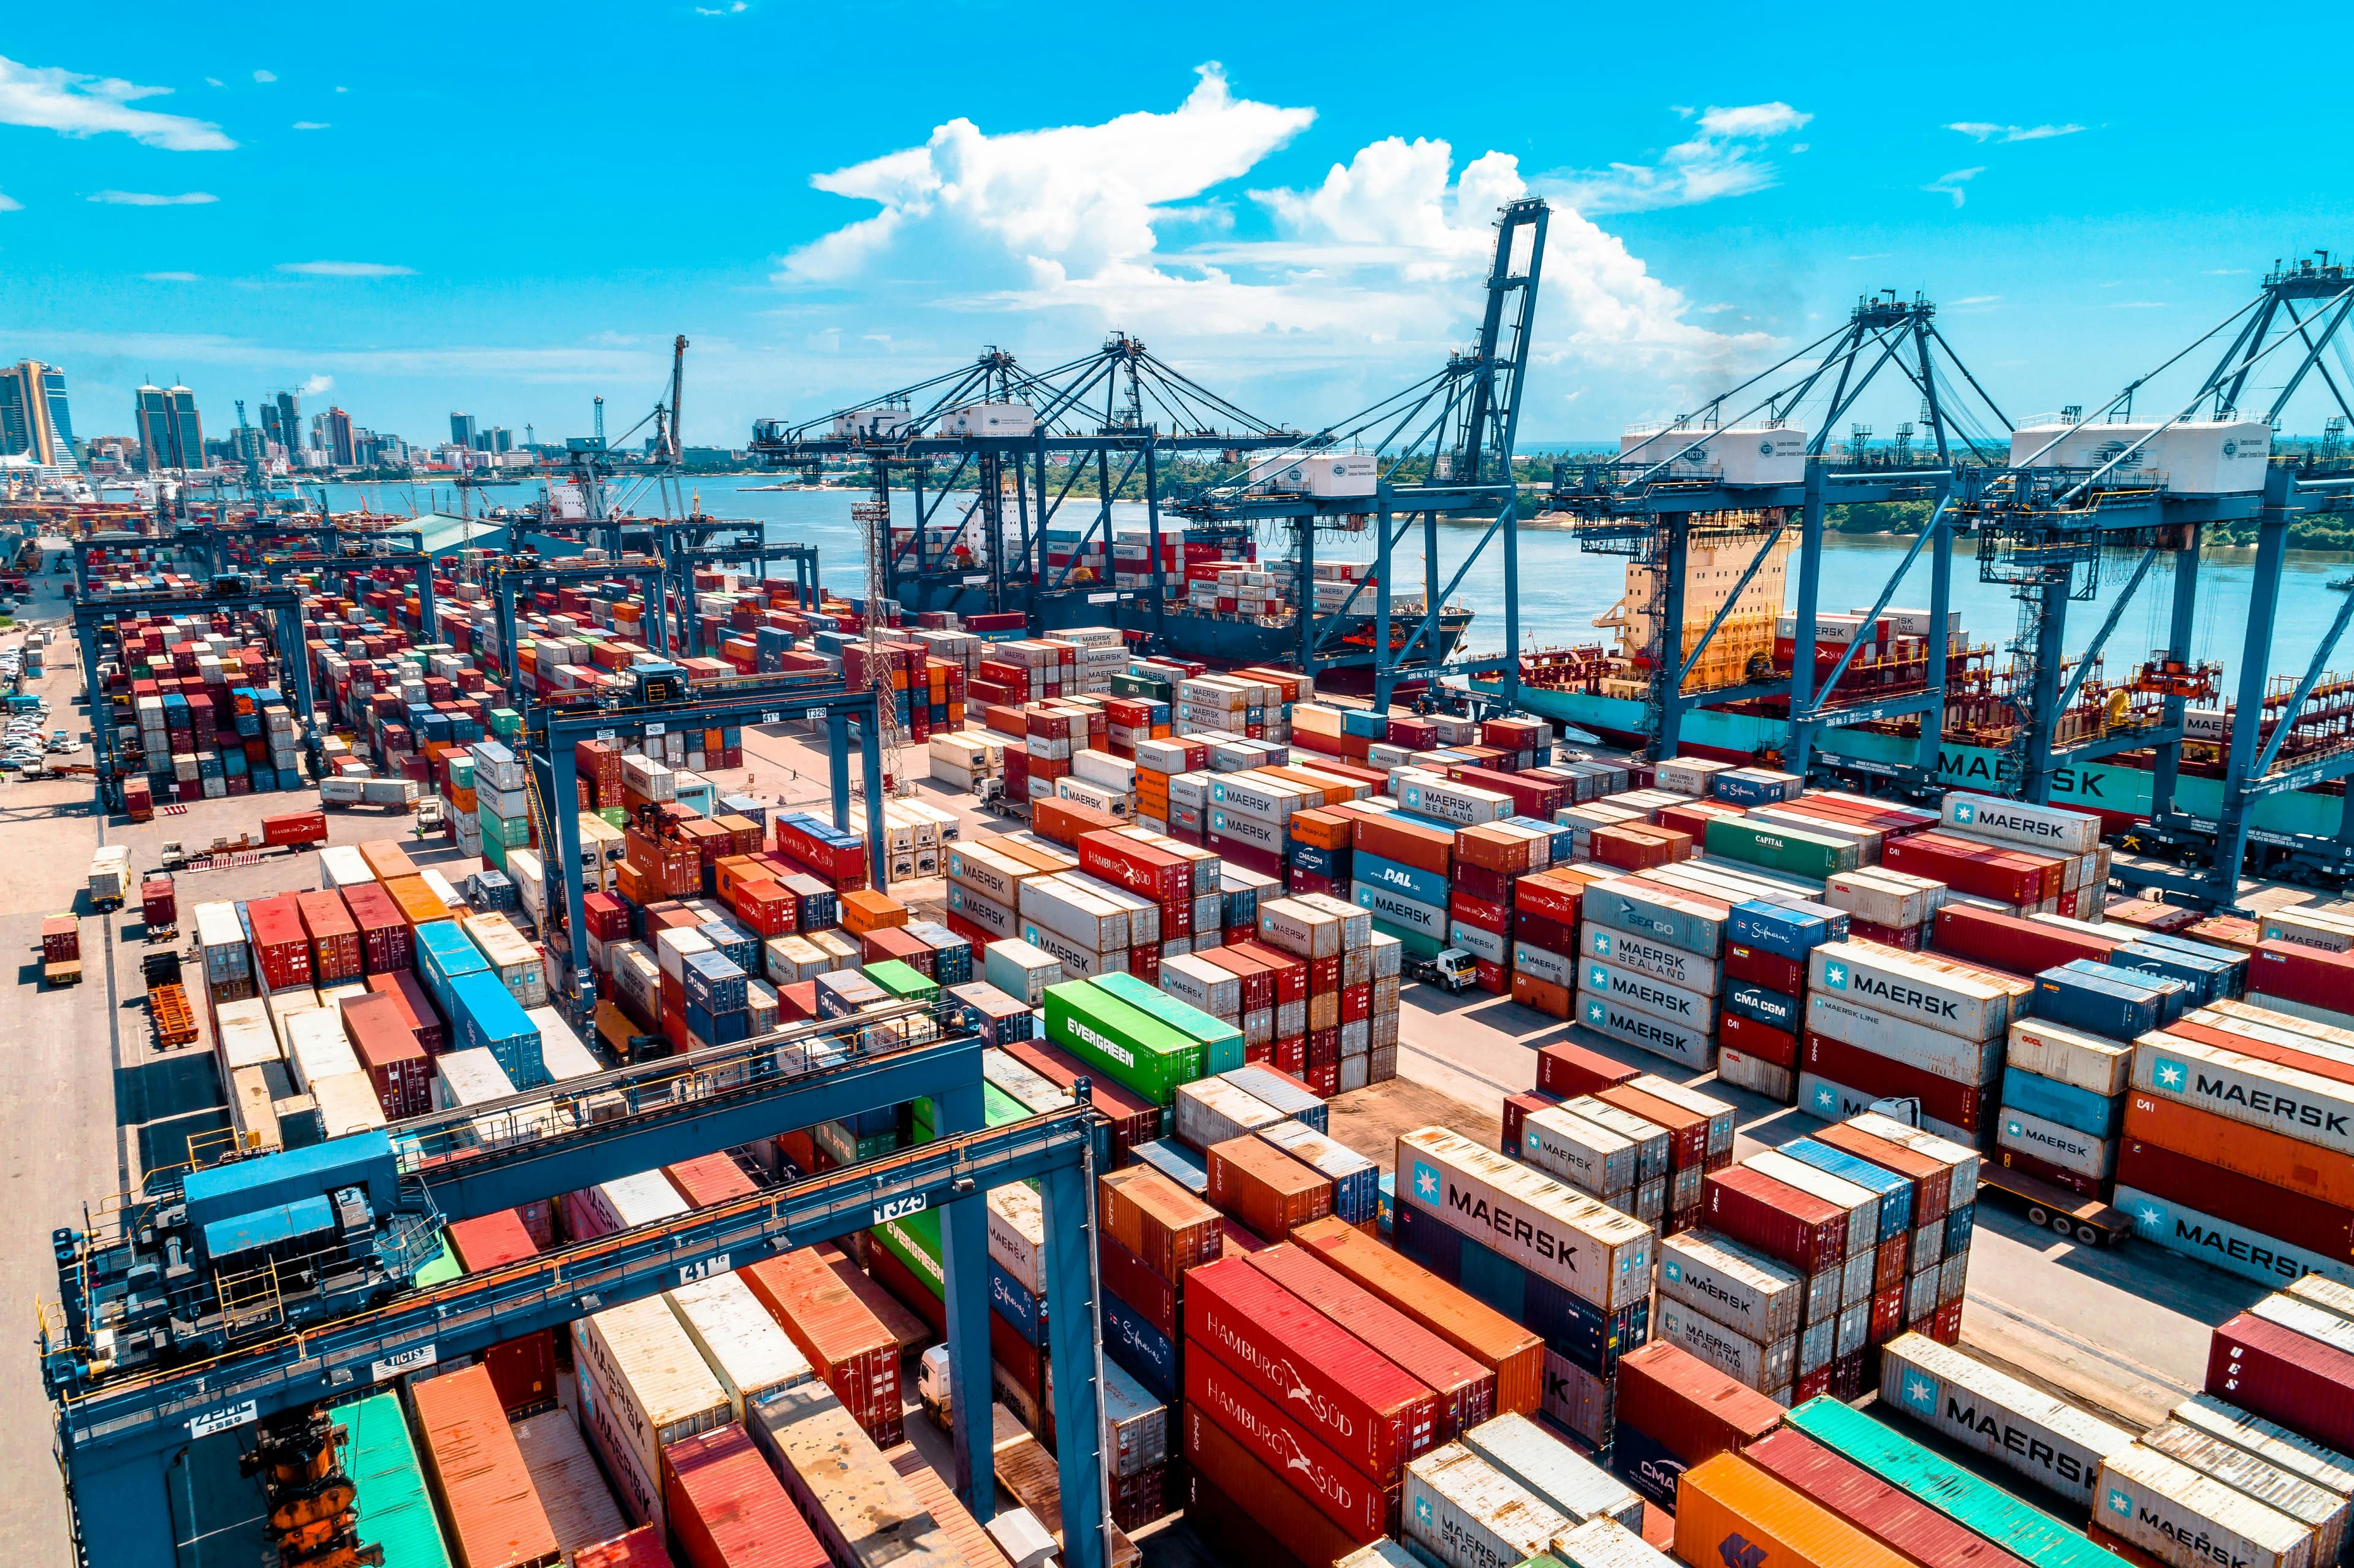
Company
500 mWhere each firm sits within that arc: targets and real progress against them, transition position, carbon efficiency with denominators that mean something, and a full source trail behind every value.

Site
30 cmWhere the transition actually lands: physical exposure, water stress, grid intensity, catchments and surrounding ecosystems - for the facilities you operate and the ones you depend on.
The foundations everything is built from.
Underneath every view is a single base model of the real economy - sectors, companies and sites, connected and continuously refreshed. It’s what makes the lens possible.
Sector pathways
Transition trajectories and benchmarks, with per-firm exposure to each.
Company records
Targets, progress, ratios and transition position, with the full source trail.
Site layer
Physical exposure, water stress, grid intensity and nature proximity, per facility.
Supply chain graph
Upstream facilities, catchments and dependencies, mapped to the ground.