2024
reporting yearFinancials
Revenue—
OpEx—
FTE6.0kFTE
Market cap (FY-end)—
Climate
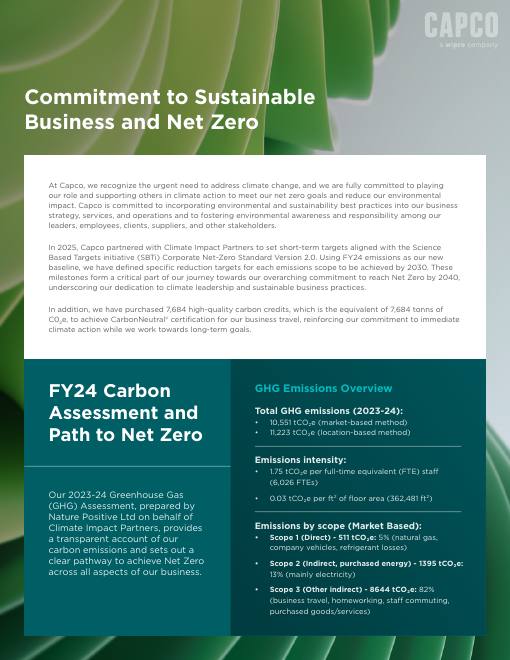
Scope 1511tCO2e
Scope 2 (market)1.4ktCO2e
Scope 2 (location)—
Scope 3 total8.6ktCO2e
Carbon flows
Offsets retired7.7ktCO2e
No targets available; showing actuals against baseline.
Carbon per million dollars of revenue. The legacy industry-standard reference (CDP, MSCI). Useful for cross-sector context, but distorted by margin — high-margin firms appear artificially efficient. Read alongside the operational and asset intensities for the full picture.
OpEx (operating expenditure) is the running cost of the business — staff, services, energy, materials. This shows how carbon-intensive operations are per million dollars of spend. Removes the margin distortion that revenue-based ratios introduce.
EVIC (Enterprise Value Including Cash) is the firm's total capital footprint — equity + debt + cash + minority interest. The EU's standard intensity measure (SFDR PAI 3) — answers: how much carbon does each million of capital deployed in this business produce?
PP&E (Property, Plant & Equipment) plus leased real-estate assets is the firm's physical infrastructure on the balance sheet. This shows the carbon intensity of that physical footprint — uses Scope 1+2+3 for consistency with the other headline intensities. Surfaces stranded-asset risk for asset-heavy firms.
Carbon per FTE (full-time-equivalent employee) — the diagnostic measure for people-leveraged businesses where headcount, not capital, drives delivery. Captures the office, energy and travel footprint per person.
It's not uncommon for carbon credits to be retired via a broker (e.g. Climate Impact Partners, ClimeCo, 3Degrees, South Pole) whose name appears in the registry instead of the end-buyer's — meaning the retirement is real but not third-party-retrievable from the buyer's name alone. We also auto-defer retirements below 1,000 tCO2e to focus attribution on material volume; use the request below to investigate sub-threshold or broker-routed retirements for this firm.
How the firm describes its decarbonisation approach in its own words — alongside the headline numbers above. Self-reported, page-cited.
As part of its carbon management plan, Capco is investing in renewable energy to reduce Scope 2 emissions by 42% from the FY24 baseline of 1,395 tCO2e to 809 tCO2e by 2030.
Pending achievement of carbon-free ambitions, Capco offsets in full the emissions associated with business travel. In FY24 the firm purchased 7,684 high-quality carbon credits (7,684 tCO2e) to achieve CarbonNeutral® certification for business travel. These are credits/offsets rather than durable removals.
Business travel is one of the largest components of Capco's footprint. The 2030 target focuses on 90% of business travel and staff commuting emissions reductions, with offsets covering business travel in the interim.
Capco prioritizes reductions in commuting and homeworking emissions as part of its Scope 3 strategy, targeting 90% coverage of business travel and staff commuting in supplier engagement and reduction activities.
Capco targets a 42% reduction in both Scope 1 (natural gas, company vehicles, refrigerant losses) and Scope 2 (mainly electricity) emissions by 2030 from FY24 baselines of 511 and 1,395 tCO2e respectively.
Capco's Scope 3 strategy includes engaging suppliers covering 60% of purchased goods and services / capital goods spend to improve data quality and reduce value-chain emissions, supporting an overall 25% Scope 3 reduction by 2030.
No target available for this scope.
No target available for this scope.
We haven't fully researched Capco yet.
Request a full evidence-chained profile — we'll dig into their carbon, nature, social & water disclosure, find their facilities and sources, and email you when it's ready.
We’ll only use your email to notify you about this request.