2026
reporting yearFinancials
Revenue—
OpEx—
FTE—
Market cap (FY-end)—
Climate
Scope 1—
Scope 2 (market)—
Scope 2 (location)—
Scope 3 total—
Carbon per million dollars of revenue. The legacy industry-standard reference (CDP, MSCI). Useful for cross-sector context, but distorted by margin — high-margin firms appear artificially efficient. Read alongside the operational and asset intensities for the full picture.
OpEx (operating expenditure) is the running cost of the business — staff, services, energy, materials. This shows how carbon-intensive operations are per million dollars of spend. Removes the margin distortion that revenue-based ratios introduce.
EVIC (Enterprise Value Including Cash) is the firm's total capital footprint — equity + debt + cash + minority interest. The EU's standard intensity measure (SFDR PAI 3) — answers: how much carbon does each million of capital deployed in this business produce?
PP&E (Property, Plant & Equipment) plus leased real-estate assets is the firm's physical infrastructure on the balance sheet. This shows the carbon intensity of that physical footprint — uses Scope 1+2+3 for consistency with the other headline intensities. Surfaces stranded-asset risk for asset-heavy firms.
Carbon per million dollars of physical infrastructure — PP&E plus leased real-estate, including upstream and downstream leased emissions (Scope 3 categories 8 + 13). The most complete view of physical-asset carbon intensity, relevant for REITs and infrastructure-heavy firms.
It's not uncommon for carbon credits to be retired via a broker (e.g. Climate Impact Partners, ClimeCo, 3Degrees, South Pole) whose name appears in the registry instead of the end-buyer's — meaning the retirement is real but not third-party-retrievable from the buyer's name alone. We also auto-defer retirements below 1,000 tCO2e to focus attribution on material volume; use the request below to investigate sub-threshold or broker-routed retirements for this firm.
How the firm describes its decarbonisation approach in its own words — alongside the headline numbers above. Self-reported, page-cited.
British Land currently procures 100% REGO-backed renewable electricity for landlord-controlled common parts and leased office space (94% achieved in FY24 vs 100% RE100 target by FY2030), sourced from a mix of wind, solar, and hydroelectric generation. On-site solar PV capacity stands at 2 MWp across 11 managed assets, generating 1,772 MWh in FY23/24 and saving 367 tCO2e. Feasibility studies for three additional retail sites identified ~3,900 MWh potential year-1 output. The firm is also investigating Power Purchase Agreements with UK-based renewable generators and modelled a PPA 'sleeving' approach for future procurement. From FY25, British Land has moved to an energy purchasing strategy that directly matches consumption with the specific renewable energy asset being procured from (granular energy).
British Land offsets residual embodied carbon (RICS A1-A5) from all committed developments using certified VCS carbon credits, retired at or shortly after practical completion. In FY24, 81% of embodied carbon from completed projects was offset. Credits retired in FY24 included removal projects (Community Reforestation in Ghana, Delta Blue Carbon in Pakistan) and avoidance projects (Kasigau REDD+, Katingan Peatland, Rimba Raya). 93% of the committed pipeline's embodied carbon has been pre-purchased. British Land reviews its carbon credit strategy annually and has incorporated enhanced due diligence criteria; it also joined an industry-level offsetting procurement guidelines working group.
British Land uses a dedicated 'Transition Vehicle' as a key mechanism for delivering its energy and carbon targets. The ESG Committee receives regular updates on this vehicle, which is central to the Greener Spaces pillar of the 2030 Sustainability Strategy. The Committee focuses on objectives set and performance against relevant targets under this pillar.
British Land tracks and targets the reduction of average embodied carbon intensity across committed, near and medium-term office developments. Progress on this metric was noted by the ESG Committee as a significant achievement in FY25 under the Greener Spaces pillar of the 2030 Sustainability Strategy.
British Land targets below 500 kg CO2e/sqm embodied carbon intensity for office developments by 2030, from an FY19 baseline of 1,000 kg. In FY24, current office developments averaged 625 kg CO2e/sqm (FY23: 646). Key levers include structural retention and reuse (e.g. 75% by weight at 1 Appold Street), lean design, electric arc furnace (EAF) steel, REGO-certified XCarb steel, renewable-energy aluminium façades, and basalt reinforcement. A Low Carbon Materials Working Group and Carbon Primer guide specification decisions. Materials passports are being rolled out across major developments.
Across retail and office assets, British Land is rolling out 100% LED lighting in landlord areas (e.g. Glasgow Fort, Serpentine Green, Broughton Shopping Park) combined with responsive control systems. The My Building smart platform (IoT-based) enables occupancy-driven HVAC and lighting scheduling; a pilot at Storey, 100 Liverpool Street achieved 35% HVAC savings and 25% lighting savings since September 2022. Voltage optimisation was trialled at St Stephen's, Hull, saving 9,618 kWh since September 2023.
British Land has installed 19 heat pumps across its managed portfolio since its first ASHP at 350 Euston Road a decade ago, cutting gas use there by 73% and saving at least 1,800 tCO2e since 2014. York House became one of the first fully electric offices with heat pumps installed in December 2023, saving ~400,000 kWh of gas. The £18m total investment in carbon-efficient interventions since FY19 has driven an 18% improvement in whole managed portfolio energy intensity and a 39% reduction in operational carbon intensity vs the FY19 indexed baseline.
All new developments and major refurbishments (>£5m) are required to undergo whole life carbon assessments from pre-design phase, using One Click LCA software aligned to RICS guidance. British Land mandates NABERS UK Design for Performance modelling for offices, targets EPC A rating, and uses a 'retrofit first' approach to retain existing structures. Low-carbon materials are specified (Electric Arc Furnace steel, low-carbon aluminium, cement replacements). Average embodied carbon intensity reduced from 1,000 kgCO2e/sqm (FY19) to 625 kgCO2e/sqm (FY24), tracking towards the 500 kgCO2e/sqm target by 2030. All committed developments from April 2020 are offset to net zero embodied carbon at practical completion.
British Land faces estimated £100m retrofit cost to bring all commercial assets to minimum EPC A or B by 2030 under MEES regulations. A portfolio-wide EPC review was completed in 2022/23 using SBEM software; results fed into asset-level business plans. By FY24, 58% of portfolio by ERV is rated A or B (up from 45% in FY23), with 42% still requiring upgrade. In FY24, £4.7m (landlord capex) was spent on carbon-efficient interventions. The firm supplements the Transition Vehicle with a £5m annual float ringfenced for retrofitting. EPC rating improvement is a component of executive remuneration (annual incentive: 20% weighting).
British Land has completed net zero carbon audits across 45+ major office and retail assets (accounting for >90% of landlord-procured energy), identifying asset-level pathways to net zero. By FY24, £18m has been invested in carbon-efficient interventions (LED lighting, heat pump replacements, HVAC improvements, BEMS upgrades, voltage optimisation) across almost half the managed portfolio. These interventions are predicted to reduce annual energy consumption by at least 13,100 MWh, saving 3,400 tCO2e/year. The Transition Vehicle (internal carbon levy, now £90/tonne) provides dedicated funding. FY24 results: 18% improvement in energy intensity and 39% reduction in carbon intensity vs indexed FY19 baselines.
British Land carries out net zero carbon audits covering over 90% of landlord-procured energy across major office and retail assets (29 audits completed last year, 14 additional retail audits in FY2023). These audits identify energy-saving interventions — LED lighting, HVAC upgrades, BEMS re-validation, heat pump installation, voltage optimisation, and demand controls — targeted to deliver a 25% improvement in whole-building energy efficiency by 2030. The Transition Vehicle (funded by an internal carbon levy of £60/tonne on embodied carbon) provides up to £40 per tonne to finance retrofit projects. In FY2022/23, 25 initiatives were implemented saving an estimated 1,024 tCO2e annually.
British Land conducts portfolio-wide EPC reviews using the Simplified Building Energy Model (SBEM) to understand exposure to F/G-rated properties (currently 3% of assets by floor area). A programme of net zero audits assesses the financial implications of retrofitting underperforming assets to achieve at least an E rating, with the goal of meeting proposed 2030 MEES standards (minimum B rating). In 2022/23, 45% of the portfolio is now graded A or B (up from 36% in 2021/22), and over 100 retail units achieved A or B ratings. Two major office buildings (350 Euston Road and Exchange House) were upgraded to B rating.
All new committed office developments target NABERS Design for Performance 5-star rating. 1 Broadgate achieved 5-star DfP target rating, first British Land building to do so. British Land is a member of BBP's Design for Performance pioneer group helping establish NABERS in the UK. Developing real-time in-use dashboards aligned to NABERS methodology.
All developments delivered after April 2020 must be net zero embodied carbon. British Land targets a 50% reduction in embodied carbon intensity at developments by 2030, with a 2030 threshold of 500 kgCO2e/sqm for offices and 450 kgCO2e/sqm for retail and residential. Approach includes whole-life carbon assessments (RICS framework), material re-use (retaining existing superstructure), cement replacement (GGBS), and a Low Carbon Materials Working Group. The average embodied carbon intensity of committed and near-term developments is now 646 kg CO2e/m2, a further 5% reduction from last year.
British Land's Sustainability Brief requires all development suppliers to meet specific embodied carbon emissions standards (500 kgCO2e/sqm GIA for offices, 450 kgCO2e/sqm for retail and residential). The Low Carbon Materials Working Group focuses on most impactful materials including concrete, steel, glass and aluminium, producing a 'Carbon Primer' in 2023 capturing current best practice. All projects require supply chain to track performance against the sustainability brief through all design stages, with quarterly project meetings for monitoring. 100% of development suppliers comply with the Sustainability Brief.
British Land targets a 75% reduction in operational carbon emissions across its managed portfolio by 2030. Interventions include installation of air source heat pumps and LED lighting at campuses and retail assets, replacement of end-of-life chillers with energy-efficient alternatives (24% energy consumption saving on one replacement), and adoption of the NABERS UK Design for Performance framework for all new construction. The Transition Vehicle (funded by the £60/tonne internal carbon levy) has deployed £7m so far for net zero interventions, primarily at campuses and retail.
Downstream leased assets (Cat 13) is the dominant Scope 3 category at 108,643 tCO2e in FY23 vs a base year of 138,163 tCO2e (FY2020). British Land commits to reduce Scope 3 GHG emissions 55% per sqm of net lettable area by FY2030. Emissions include FRI/non-landlord obtained energy at non-BL managed assets, landlord energy in leased space, and upstream emissions from landlord water use. Improved data coverage (76% actual vs 30% prior year) was achieved through a new occupier-procured energy data collection solution rolled out across retail assets.
Retrofit-first approach: average embodied carbon on office developments 646kg CO2e/sqm vs 1,000kg FY19 baseline, targeting 500kg by 2030. Initiatives include 40% X-Carb low-carbon steel at The Dock Shed (saving ~1,500 tonnes), 95% GGBS low-carbon concrete at 1 Broadgate substructure, upcycling 40% of existing aluminium cladding at 2 Finsbury Avenue, reused raised access flooring at Exchange House (saving 200 tonnes). Internal Low Carbon Materials Working Group established; signed ConcreteZero and SteelZero pledges.
British Land operates an internal carbon levy of £60 per tonne of embodied carbon associated with new development projects. Two-thirds of the Transition Fund is available to finance retrofitting projects that improve EPC ratings and reduce operational carbon emissions; the remaining third purchases carbon credits for residual embodied carbon. This mechanism ensures carbon cost is factored into development appraisals and incentivises low-carbon design choices. The fund also provides an annual float of £5m to support the sustainability programme budget across Campuses and committed a further £10m in FY24 for energy initiatives.
British Land targets 500 kg CO2e per sqm embodied carbon for office developments and 450 kg CO2e per sqm for retail/residential by 2030, well below the RIBA Climate Challenge 2030 standard of 500 kg CO2e/sqm. Whole life carbon assessments are undertaken using One Click LCA software aligned to RICS guidance for all developments and major refurbishments. Material choices (e.g. 95% GGBS concrete piles, electric arc furnace steel) and structural retention strategies (retaining half the original structure at LPS) have already delivered intensities of 389 kg CO2e/sqm at 100 Liverpool Street and 436 kg CO2e/sqm at 1 Triton Square.
Net zero audits completed at all major office and retail assets with pathways embedded in business plans. £10m invested in energy/carbon efficient interventions since FY19 with further £5m committed. Transition Vehicle (£40/tonne of embodied carbon levy + £5m annual float) funds retrofit projects: air source heat pumps now at five assets, LED lighting rollout, chiller replacements (e.g. Broadwalk House saving 30 tonnes CO2e/year). 40% reduction in operational carbon intensity (offices) vs 2019 baseline achieved.
Target 50% reduction in embodied emissions (RICS A1-A5) vs 2019 benchmarks — Offices to 500kg CO2e/sqm, Retail/Residential to 450kg CO2e/sqm by 2030. Average embodied carbon in office development pipeline was 632 kg CO2e/sqm in FY22. Uses One Click LCA software across all developments. Piloting low-carbon materials including GGBS cement replacement (40% at Norton Folgate), post-tensioned concrete, cross-laminated timber, electric arc furnace steel at Canada Water A1. 100% FSC wood targeted. Material reuse at Norton Folgate retained ~80% of floors and most timber joists.
Completed 29 net zero audits covering major assets (90% of landlord procured power), identifying interventions to deliver 25% improvement in whole building energy efficiency by 2030 vs 2019. At Exchange House, planned interventions (~£2.5m, <1% of building value) including LED lighting, heat pump replacement, chiller optimisation, CO2 ventilation controls expected to deliver ~50% energy efficiency improvement. Total retrofit cost across portfolio estimated ~£100m with two-thirds funded through service charge or directly by occupiers. EPC ratings to be raised to A or B by 2030 ahead of expected MEES legislation.
Internal carbon levy of £60/tonne CO2e on embodied carbon in developments since April 2020. £20/tonne earmarked for nature-based offset credits; £40/tonne plus £5m annual float directed into the Transition Vehicle which funds energy efficiency retrofits on the standing portfolio. Total cumulative investment to date £19.5m. Annual savings from completed retrofits: 337 tCO2e and 1,155,186 kWh.
25% improvement in whole building energy intensity by 2030 vs 2019. Six net zero carbon asset audits piloted at 3 retail and 3 office assets. Transition Vehicle allocated £5.8m to date, including LED lighting upgrades at Regent's Place (£140,000 investment, 100 tonnes/year carbon saving, £50,000/year tenant savings) and at Glasgow Fort and Fort Kinnaird (200+ tonnes saved).
50% embodied carbon intensity reduction target (RICS A1-A5) by 2030 vs 2019 baselines: Offices 1000→500 kg CO2e/sqm, Retail/Residential 900→450. 100 Liverpool Street achieved 389 kg/sqm by retaining one-third of steel frame, half the concrete, recycled aggregates and cement replacement. 1 Triton Square refurbished 3,500 sqm of glass panels (66% cost saving, saved 25,000 transport miles), >70% cement replaced with low-carbon alternatives. FY21 portfolio average: 640 kg CO2e/sqm.
New developments to 'design out fossil fuels where possible'. Norton Folgate gas restricted to retail A3/A4 use only — offices and A1 units all-electric. 1 Broadgate fully electric with air/water source heat pumps, thermal stores, mixed mode ventilation, photovoltaic array on roof. Beyond 2030, portfolio to perform in line with UKGBC Paris Proof 2050 targets.
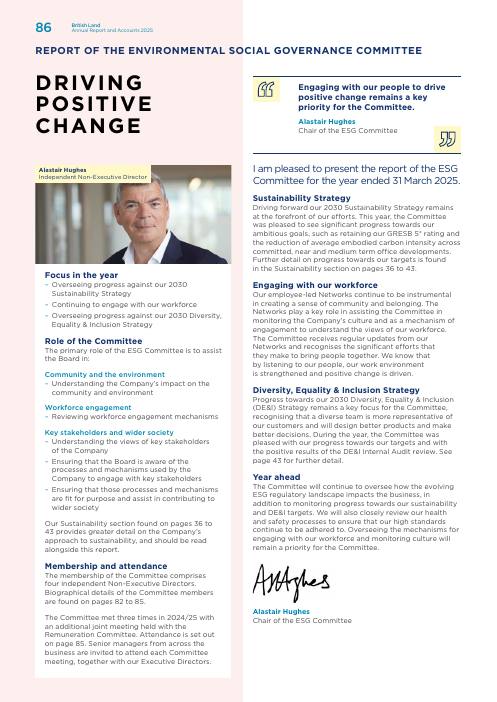
British Land pursues leading sustainability accreditations, including the GRESB 5* rating, to demonstrate its position as a leader in delivering the low-carbon real estate its customers demand. The Committee agreed to prioritise accreditations of strategic importance and value, acknowledging the significant business impact of meeting increasing reporting criteria.
British Land is adopting NABERS UK Design for Performance (DfP) on all office developments to ensure accurate energy performance prediction, targeting 5-star NABERS and 90 kWhe/sqm whole-building operational efficiency in line with UKGBC 2030 targets. In FY23, 1 Broadgate became the first UK building formally registered for NABERS DfP (5 stars target). In FY24, five developments underwent NABERS design reviews and 3 Sheldon Square received a 4.5-star DfP certificate. An internal NABERS Working Group with Verco develops bespoke implementation guidance.
Scope 3 Cat 13 (downstream leased assets) at 84,184 tCO2e is a primary focus: British Land rolled out a solution in FY23 to obtain occupier-procured energy data for retail let space, covering 51 of 53 managed retail assets (~2,000 units), increasing actual data coverage to 76%. Green lease clauses were updated in 2023 to highlight sustainable occupation requirements. The firm held roundtable discussions with all office customers and 15% of retail customers (by floor area) in FY23/24, identifying joint opportunities in strategy alignment, data sharing, and funding for energy efficiency. Two ESG-focused events were held with 120 and 70 office occupier attendees respectively. Target: 55% reduction in Scope 3 intensity per sqm by FY2030 (24.73% achieved to date).
British Land's Sustainability Brief requires all development suppliers to track and report embodied carbon at each RIBA design stage, appoint sustainability consultants, and comply with ISO 14001. The Low Carbon Materials Working Group reviews current and emerging low-carbon materials (concrete, steel, glass, aluminium) and produced a 'Carbon Primer' in 2023 capturing best practice. All office projects must use NABERS UK Design for Performance modelling. Suppliers providing Environmental Product Declarations (EPDs) are required before procuring new materials. The internal carbon levy (£90/tonne) incentivises design teams to reduce embodied carbon.
Tenant energy use dominates British Land's Scope 3 footprint via downstream-leased assets. The company now reports whole-building portfolio intensities including retail occupier-procured energy (adding ~205 MWh/year to scope). It integrates energy and carbon clauses into new and renewed leases, shares building energy data with occupiers via digital platforms, and held its first occupier Sustainability Summit in FY24. Asset-level net zero pathways are presented to occupiers, and the 2030 Sustainability Brief updated with more demanding KPIs to drive supply chain collaboration.
Exploring key net zero criteria to be used during procurement of goods and services from contractors. Updated Supplier Code of Conduct in FY23 to include specific UN Sustainable Development Goals requirements. Plan to incorporate net zero KPIs as contractually binding requirements in new supplier contracts. 93% of supplier workforce paid at least the Real Living Wage.
Downstream leased emissions dominate Scope 3 for British Land as a REIT. Green leases introduced as standard on new retail and office leases. Energy monitoring software rolled out across managed retail assets in FY23 (51 of 53 assets covered), extending to FRI/non-managed in FY24. Four customer round tables held with major occupiers. ESG standing agenda item at customer/property meetings. Occupier-procured retail emissions: 64,012 tCO2e in FY23.
British Land actively engages occupiers to reduce Scope 3 Category 13 (downstream leased asset) emissions, which are covered by its SBTi intensity target (Int 1). The company rolled out a solution to obtain occupier-procured energy consumption data in retail let space; full-year occupier data was received for 51 out of 53 managed retail assets. Roundtable discussions with close customers explored collaboration on fit-out, data sharing, and net zero strategy alignment. Occupier-specific energy efficiency opportunities identified through net zero audits are shared with tenants to support the shared goal of reducing their carbon footprint.
British Land engages 31% of customers by number on climate issues through roundtable discussions, green lease clauses, and data sharing. In 2022/23 the firm reviewed and enhanced 'green lease clauses' in standard office and retail leases to more explicitly highlight sustainable occupation requirements. A solution was rolled out to obtain occupier-procured energy consumption data in retail let space, covering 51 of 53 managed retail assets, increasing actual data coverage from 30% to 76% for downstream leased asset emissions. Customers can access energy management systems to review demised space performance.
Operational carbon reduction depends on tenant engagement. Liaising with key customers to understand their energy reduction plans and investigate joint initiatives. Integrating energy and carbon clauses into new and renewed leases, including access to energy data where procured directly by tenants. Exploring green leases, building charters and efficiency incentives. Implementing energy monitoring procedures for retail and leisure units (currently estimated for occupier-procured energy). From 2030 will offset residual operational carbon across the portfolio.
Introduced Contractor Framework identifying Sustainability KPIs for new contractors on asset management initiatives. Incorporating key Net Zero Carbon criteria into procurement of goods and services from contractors by 2024. Anti-modern slavery audits of 10 high-risk suppliers (all scored above 77%); 79% of supplier workforce paid the Real Living Wage. Embedded Net Zero criteria into pre-acquisition due diligence.
Downstream leased assets (Scope 3 Cat 13) dominate Scope 3 at ~81 ktCO2e in FY21. Approach: NABERS UK Design for Performance methodology adopted at 1 Broadgate targeting 5.5* rating; smart meter rollout (200 meters at 100 Liverpool St); BREEAM In Use certifications across 30 standing assets over next two years; new developments designed all-electric where possible.
Supplier Code of Conduct updated and mandated for all suppliers; widened scope of responsible sourcing requirements to include all goods. Contractor Framework launching to monitor sustainability KPIs for new contractors. 47% of development supply chain spend with SMEs; 37% within site borough. Mandatory whole-life carbon assessments on all developments.
| Scope | Base | Target | Reduction | Alignment | Progress | Status |
|---|---|---|---|---|---|---|
| Scope 1 + 2Absolute | 2020 | 2030 | −51% | 1.5°C | 1.8% reduction achieved vs 51% target (4% of the way there). Linear pace expects 20.4% by now. −1.8% reductionof −51% target · 4% there | Off track |
| Scope 3Intensity | 2020 | 2030 | −55% | intensity — not tracked vs absolute | — |
No target available for this scope.